|
Hook | Questions | Procedures | Data Investigation | Analysis | Findings | New Questions |
||
|
|
||
|
The student page contains the hook only. It is intended to spark interest in the topic and lead students to ask questions or make predictions. We all know that summers usually mean warmer temperatures and winters mean cooler temperatures, but have you ever hear somebody say on a hot summer day, "I would love to go up to the mountains to get away from this heat." Or maybe you've heard somebody else say on a cold winter day, "I would love to take a vacation down south so I could bask in the warm sun."
When temperature is the issue, what's the big deal about...
How would you expect the temperatures of the following cities to vary? Why? Go to weather.com's averages and records and find the average yearly temperature for each city. Then look up each cities elevation and latitude at the Global Gazetteer.
Students might ask similar but different questions than those listed here. The more students are guided to ask specific questions, the less inquiry-oriented the activity. Two factors, elevation and latitude, have been briefly introduced as potentially affecting a given city's average temperature. Students might list other factors as well. The point to this activity is to help students see patterns in temperatures around the world, namely that temperature can be determined by a locations elevation and latitude. Questions that would be pertinent to this activity are:
To predict temperatures for different locations, developing a mathematical equation from these relationships would be helpful, so you might also want to lead your students to ask:
After students have asked questions related to the topic, they will need to decide a number of things, including:
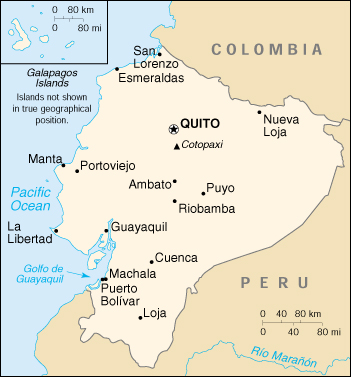
Type(s) of Data Average temperature data, either yearly, monthly, or seasonal, for many locations will be needed for this activity. Also, the elevation and latitude for each location will be needed. Defining "Correlation" This activity might be a good opportunity to introduce the concept of correlationto your students. Meriam-Webster.com defines correlation as a "relation existing between phenomena or things or between mathematical or statistical variables which tend to vary, be associated, or occur together in a way not expected on the basis of chance alone." It might be helpful to use the word in a sentence, such as, "There is a correlation between smoking and lung cancer." Defining "Regression" and "Trend Line" This activity might also present an opportunity to introduce or futher expose students to regression and trend lines. It is likely that students will complete a linear regression on collected data (temperature vs. elevation and temperature vs. latitude). Since these might be foreign concepts to students, they might require some explanation. Investigation Tool(s) Students will be using numerical data. Both graphing calculators and spreadsheets will scatter plot data and then calculate trend lines and their equations. The example shown uses a spreadsheet. Manipulating Data To caculate trend lines, students will need to invidually scatter plot temperature vs. elevation and temperature vs. latitude (see Data Investigation). When selecting locations for the elevation scatter plot, best results will be found when all the locations are relatively near each other but at different elevations. Countries such as Ecuador, Peru, India, Nepal, and Switzerland have cities with varying elevations. When selecting locations for the latitude scatter plot, best results will be found when all locations are at or near the same elevation but at different latitudes. There is often a giant leap from defining the type(s) of data desired and actually finding the data. Providing guidance to students in finding the necessary data may be necessary. To find average temperatures, elevation, and latitude, students will need to use web sites such as WorldClimate.com or WeatherBase.com. Temperature data for thousands of separate places can be found at these sites. Latitude, longitude, and elevation of these places are usually provided as well. Elevation For this example, Ecuador was chosen as a country to seek the relationship between elevation and temperature. The country borders the Pacific Ocean and quickly rises into the Andes mountains, and as a result, Ecuador has cities with widely varying elevations. The CIA World Factbook might be a good place to find a map of the country showing its major cities.
Latitude For this example, several North, Central, and South American cities were chosen. In order to eliminate elevation as a possible cause for variation in temperature, all cities chosen are relatively near sea level. A world map or globe might be helpful for students as they choose cities for this part of the investigation.. A Raw data/information usually has to be manipulated before it can answer any questions. Students might be unaware of how data can best be manipulated, so teacher guidance may be appropriate. Elevation
Latitude
No result is meaningful unless communicated appropriately. Discussion of findings should be supported. There may or may not be definitive answers to the questions students raised. In this example we produced four separate equations, one for elevation and three for latitude. Elevation Actual results will vary depending on cities selected, as well as a variety of other factors.
Latitude Actual results will vary depending on cities selected, as well as a variety of other factors.
Combining Equations We cannot quite combine two equations together. For example, it will not work to create an equation Temperature = -0.0026 (Elevation) + 77.177 -0.988 (Latitude) + 96.827. By putting 0 in for elevation and 30 in for latitude, we would get:
We should first use one of the latitude equations to establish what the temperature of a city would be if it were located at sea level. We could then adjust this temperature for the city's elevation. Consider the following examples. Examples Mexico City, Mexico Mexico City is located at 19.4°N and is 7,329 feet above sea level. We'd start with the equation for locations below 20°N (the contant 80°F) and then adjust for elevation:
WorldClimate.com shows an that the average temperature of Mexico City is 60.8°F, so 60.9°F is very close. Tahoe City, CA For example, consider Tahoe City, California. Tahoe City is located at 39.2°N and is 6,227 feet above sea level. We would start with the latitude equation for locations between 20°N and 60°N Temperature and then adjust for elevation:
WorldClimate.com shows an that the average temperature of Tahoe City is 43.3°F, so again we're not far off in our prediction of 41.9°F. Answers often lead to new questions, starting the inquiry cycle over again. This activity might cause students to ask additional questions, such as:
The following web sites might be helpful in helping students explore further how elevation, latitude, and also seasons are related to temperature: |

Activity created by Philip Molebash
Based on an activity created by Thomas Draganski, Marcia Halpern, Thuc Ho, and Jennifer DeLuna